Introduction
Kubecost has already been deployed into your cluster. We can check to see if it's up and running. Run:
~$kubectl get deployment -n kubecost
kubecost-cost-analyzer 1/1 1 1 16m
kubecost-kube-state-metrics 1/1 1 1 16m
kubecost-prometheus-server 1/1 1 1 16m
To access the Kubecost dashboard we'll expose it through a kubectl port-forward command. Expose the Kubecost dashboard open a new terminal in your Cloud9 IDE and run the following command:
~$kubectl port-forward --namespace kubecost deployment/kubecost-cost-analyzer 8080:9090
Forwarding from 127.0.0.1:8080 -> 9090
Forwarding from [::1]:8080 -> 9090
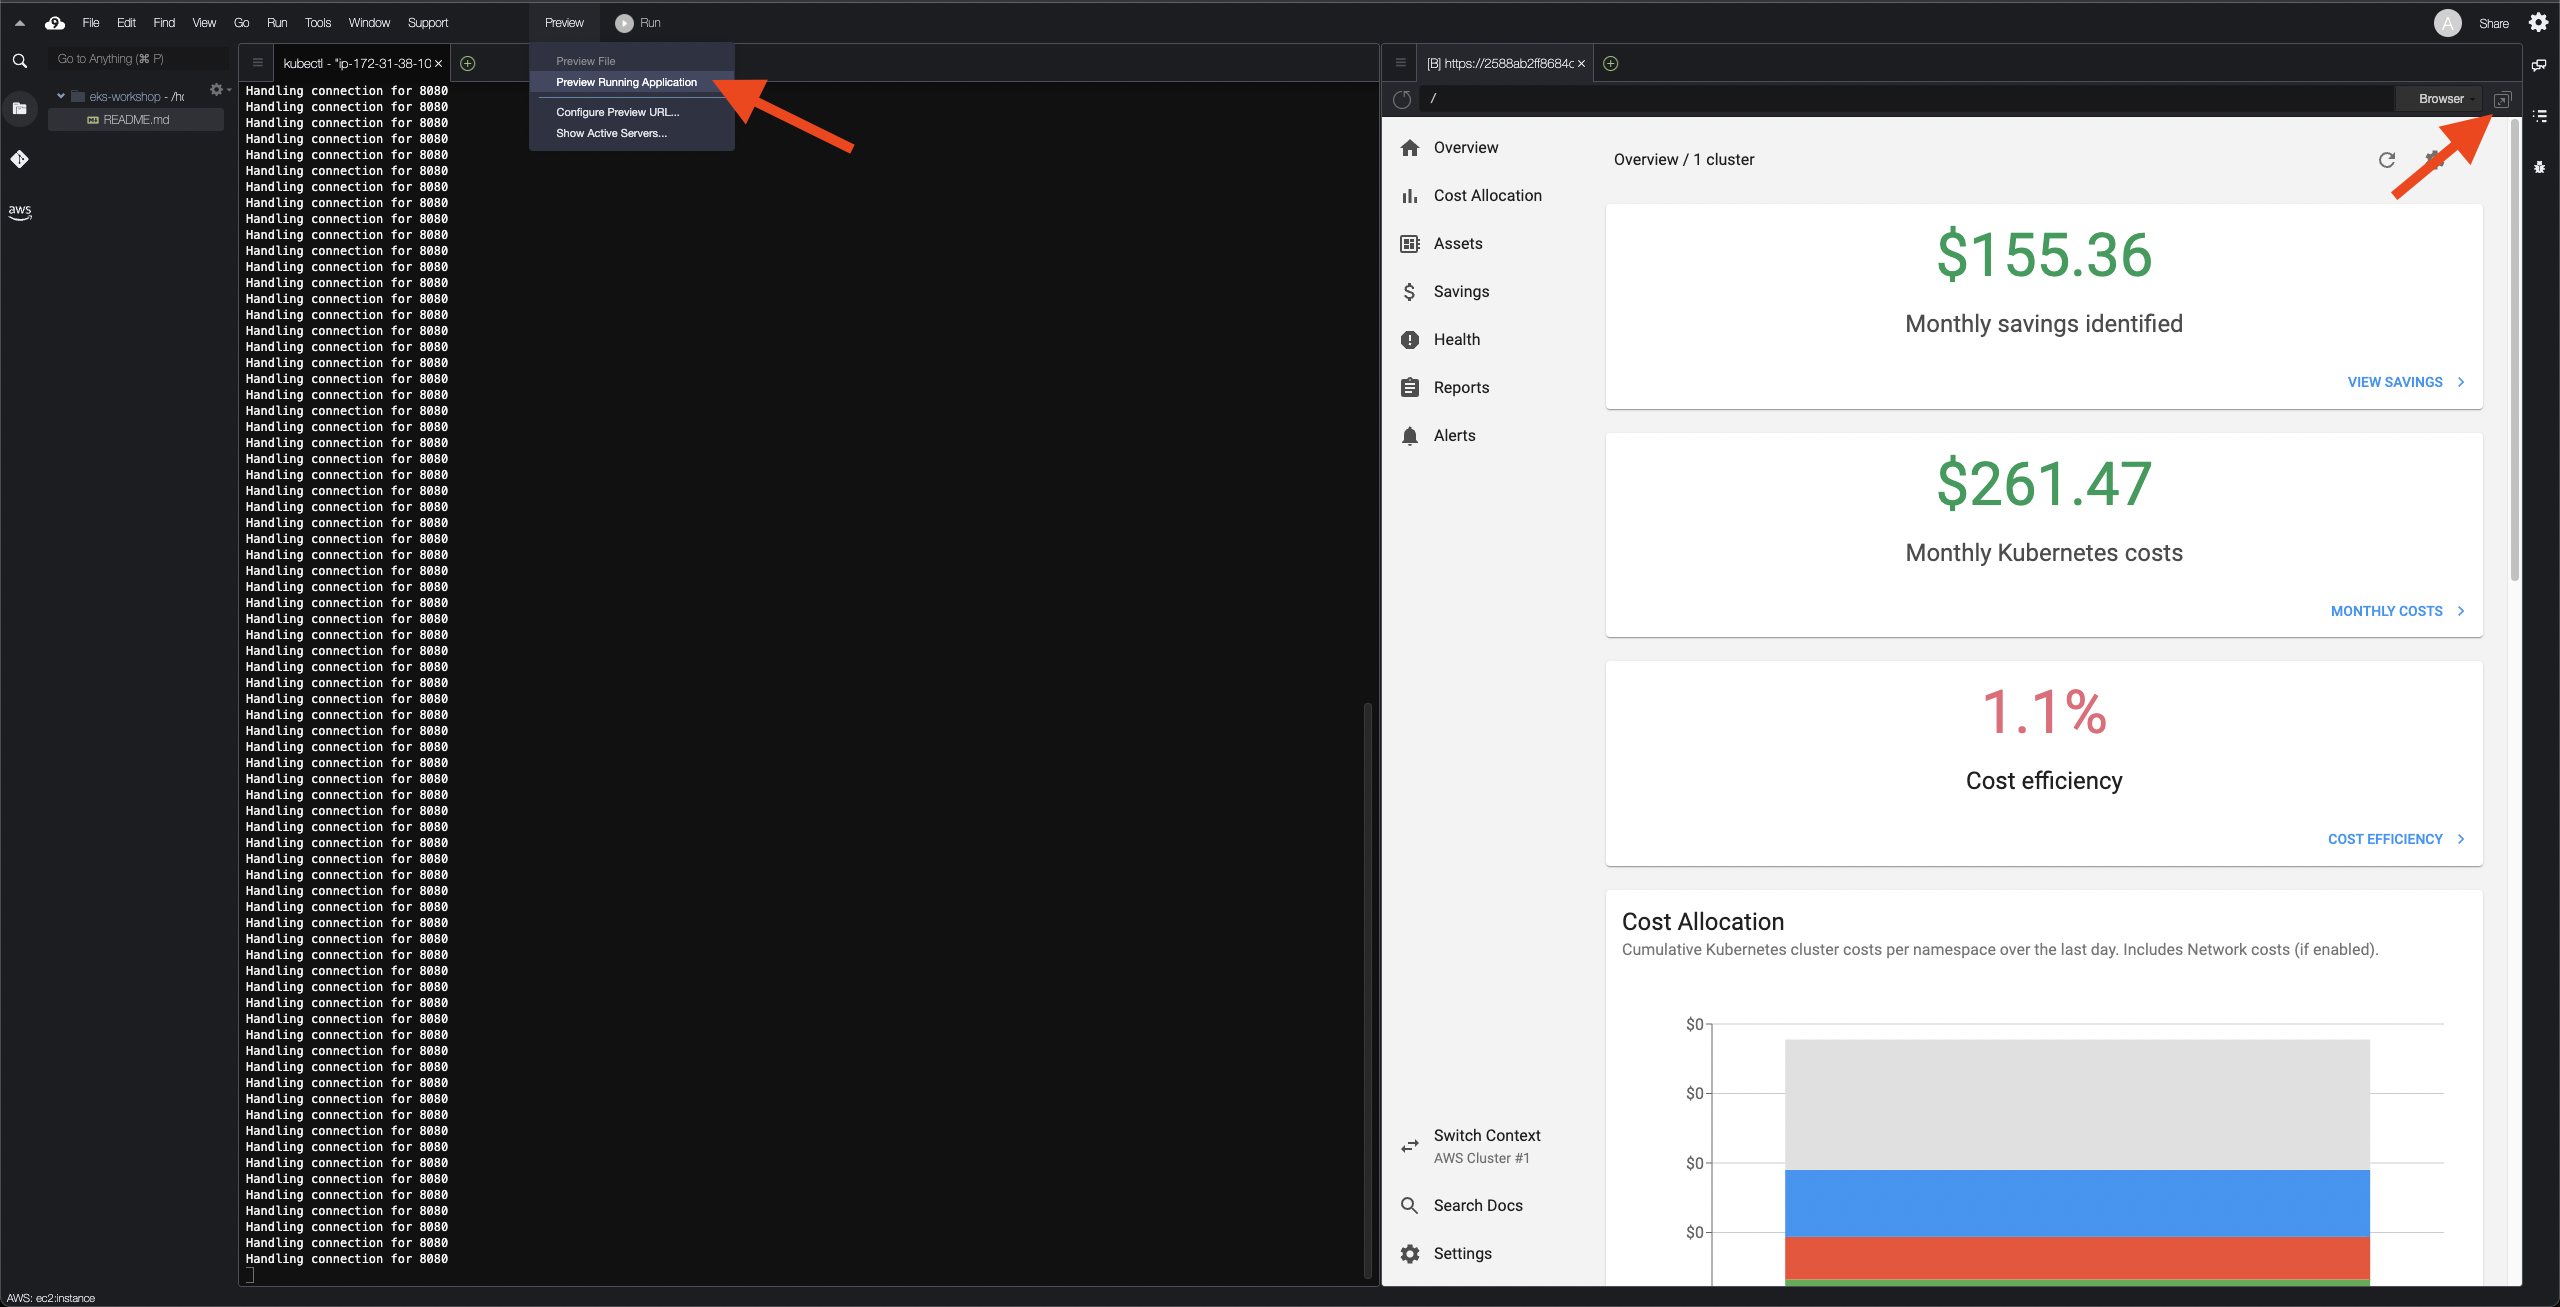
In your Cloud9 environment, click Preview / Preview Running Application to access dashboard. You can click on Pop out window button to maximize the browser into a new tab. Leave the current terminal running because if you kill the process, you will loose access to the dashboard. See the below immage for more details.
https://us-east-1.console.aws.amazon.com/cloud9/ide/2an0f568zlmnfkfb3w59iviyx6dedjmi
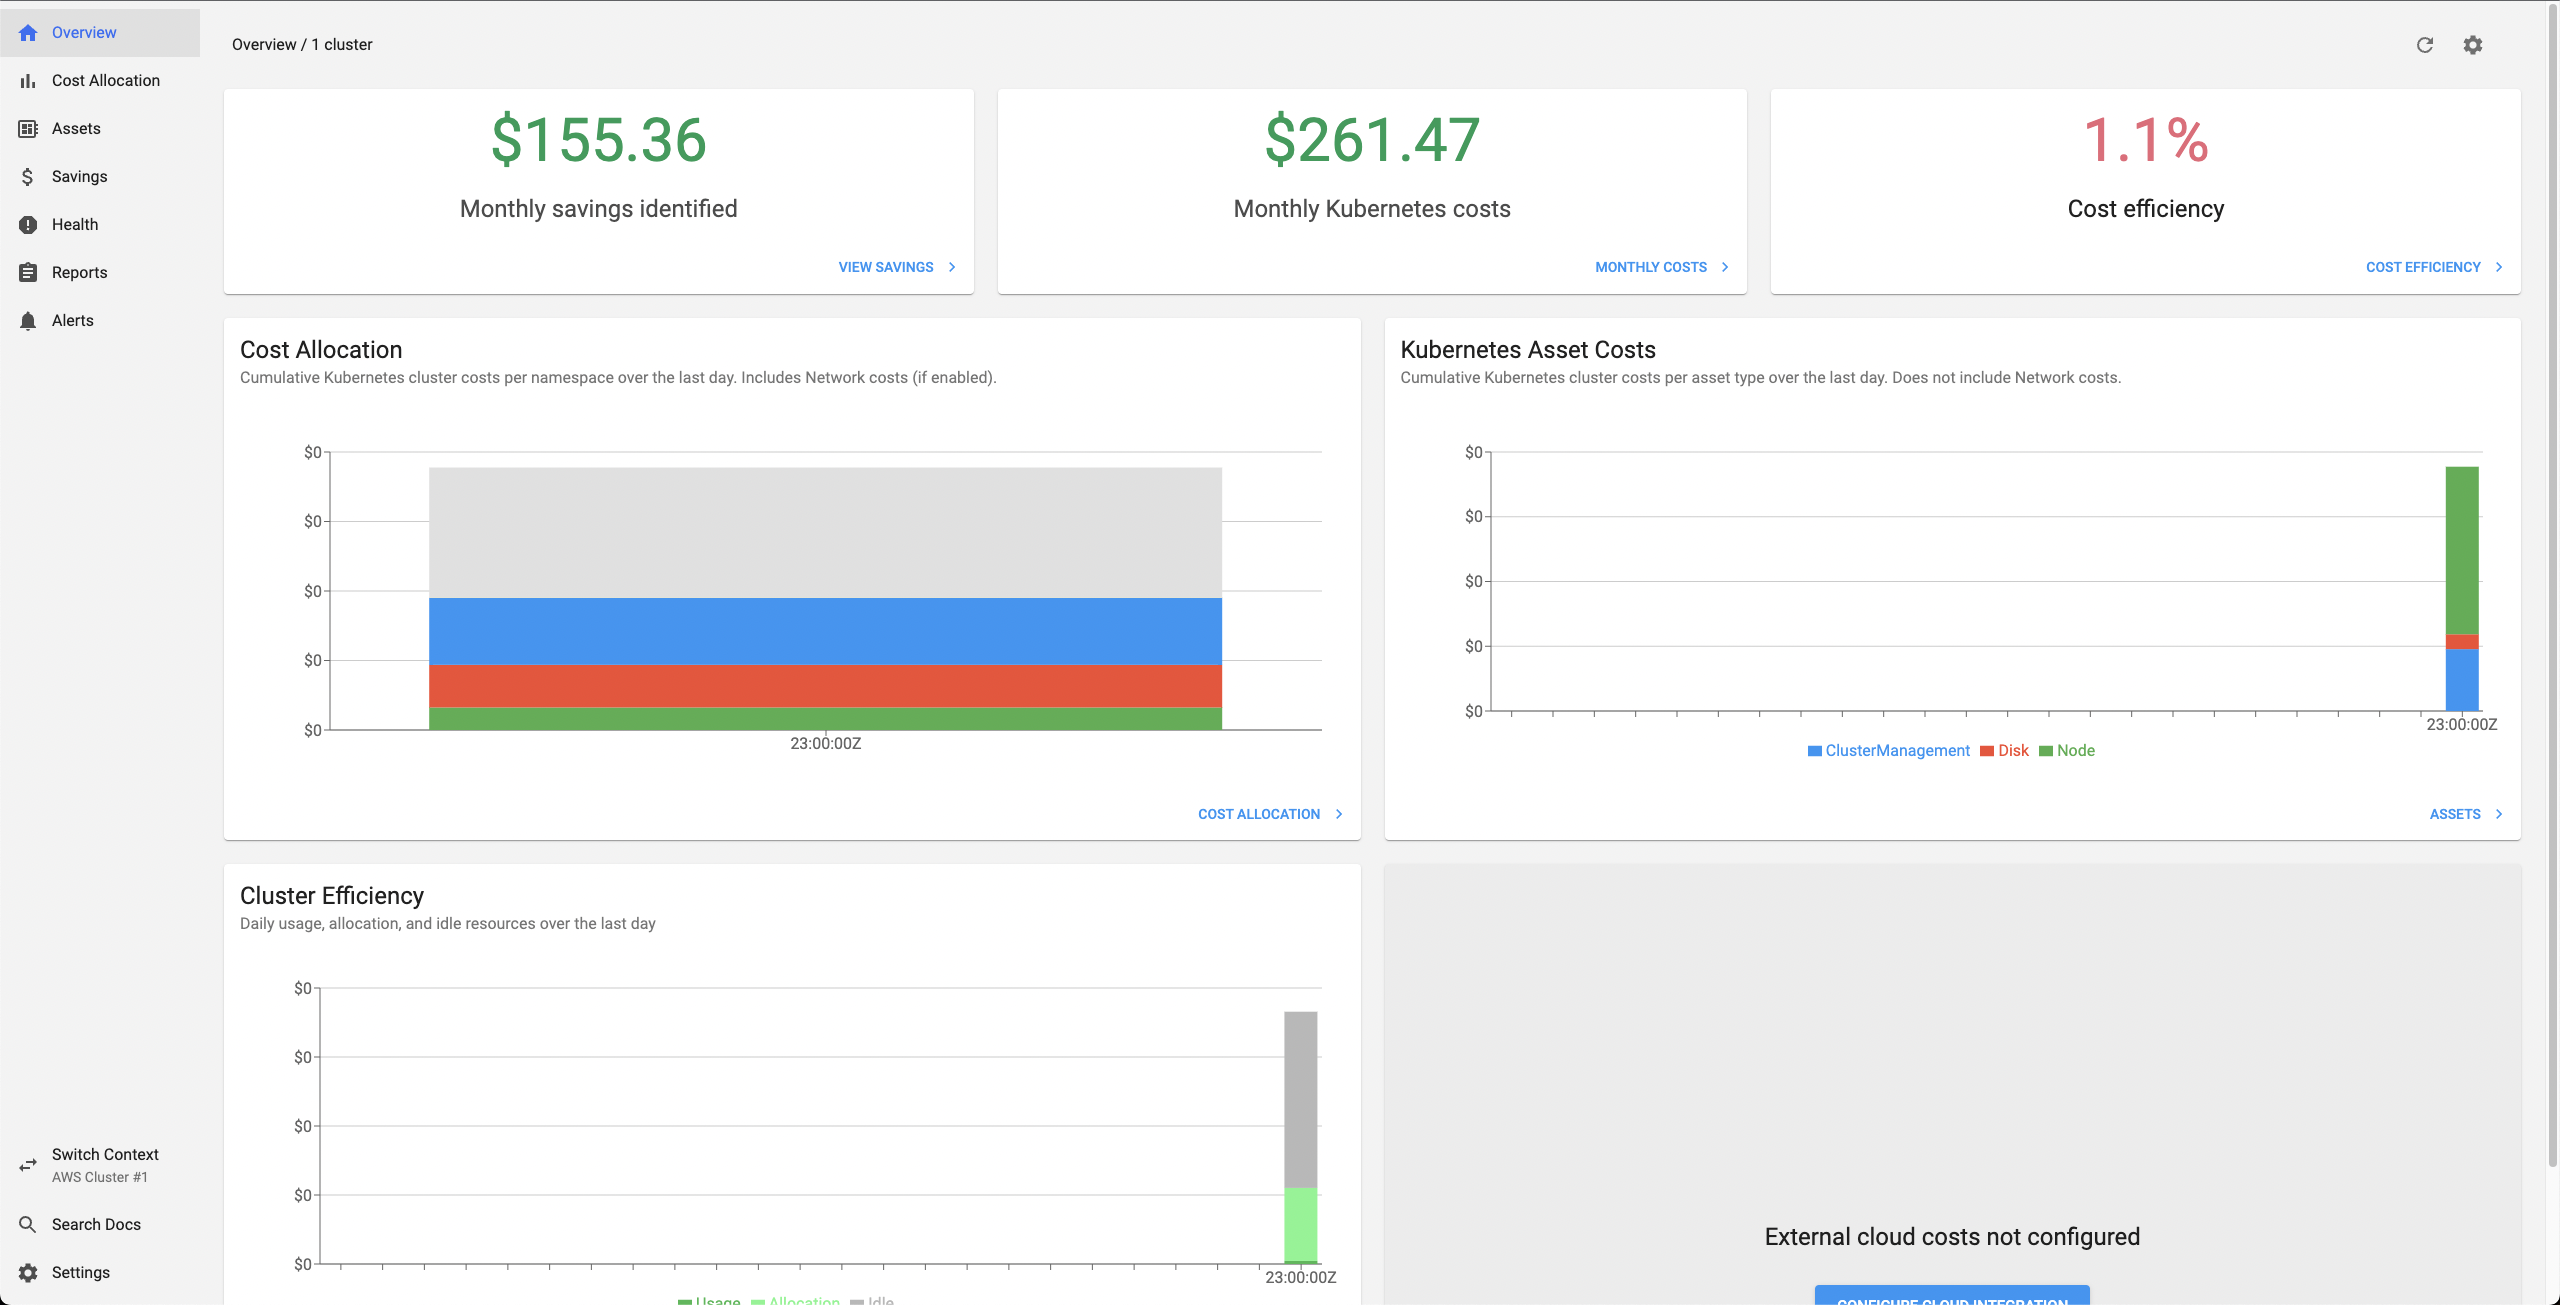
You should see the below dashboard once you have completed the steps.
https://2an0f568zlmnfkfb3w59iviyx6dedjmi.vfs.cloud9.us-east-1.amazonaws.com/overview